
Micron Filter Chart and Whole House RO Guide
The most common advice about a micron filter chart is also the most misleading: choose the smallest number available and assume your water problems are solved. That approach confuses suspended particles with dissolved contaminants. A fine cartridge can capture sediment, but it can't remove dissolved salts, nitrate, arsenic, or many metals, because those substances are far smaller than the pores used for ordinary sediment filtration.
For Southwest Florida homeowners on private wells, the chart is still useful. It helps determine how to protect equipment and prepare water before it reaches a membrane. But it isn't a complete treatment design, and it shouldn't be used as a substitute for water testing. The central question isn't “What is the smallest micron rating?” It's “What contaminant am I treating, and what verified process is designed to remove it?”
Rethinking the Standard Micron Filter Chart
A micron chart describes particle size and pore size. It doesn't describe every form of water contamination. Sand, silt, rust, and other suspended solids have physical dimensions that a filter can intercept. Dissolved minerals and salts behave differently. They pass through ordinary sediment cartridges even when the water looks perfectly clear.
That distinction matters in Cape Coral and Lee County well-water applications. A homeowner may install a very fine cartridge, see clearer water, and assume the treatment is complete. The cartridge may be doing its job against suspended particles while leaving dissolved contaminants untouched. A smaller number can therefore create confidence without addressing the actual risk.
What the chart can do well
Use the chart as a prefiltration planning tool. A coarse stage can intercept larger particles before they reach a finer cartridge. This staged arrangement reduces the amount of sediment presented to the final pretreatment stage and helps protect equipment that needs cleaner feed water.
The chart can also help diagnose why a cartridge is loading quickly. If well water carries sand, iron particles, or seasonal turbidity, a tight filter placed first may collect too much material too soon. The result can be rising pressure loss, more frequent cartridge changes, and unstable flow.
Practical rule: Smaller is finer, but finer isn't automatically better. The correct rating depends on the contaminant, the filter's rating method, the system's flow demand, and the treatment stage's purpose.
Where the chart stops being useful
A micron rating doesn't tell you whether a filter removes total dissolved solids, nitrate, arsenic, or dissolved metals. Those concerns require treatment selected from laboratory results, not from a particle-size comparison.
That is where whole-house reverse osmosis becomes the more important design question. Sediment filtration remains valuable, but mainly as protection for the RO process. The membrane handles a category of contaminants that a conventional micron chart cannot represent accurately. A reliable system uses both tools in the right order, rather than asking one cartridge to perform every job.
Nominal Versus Absolute Filtration Ratings
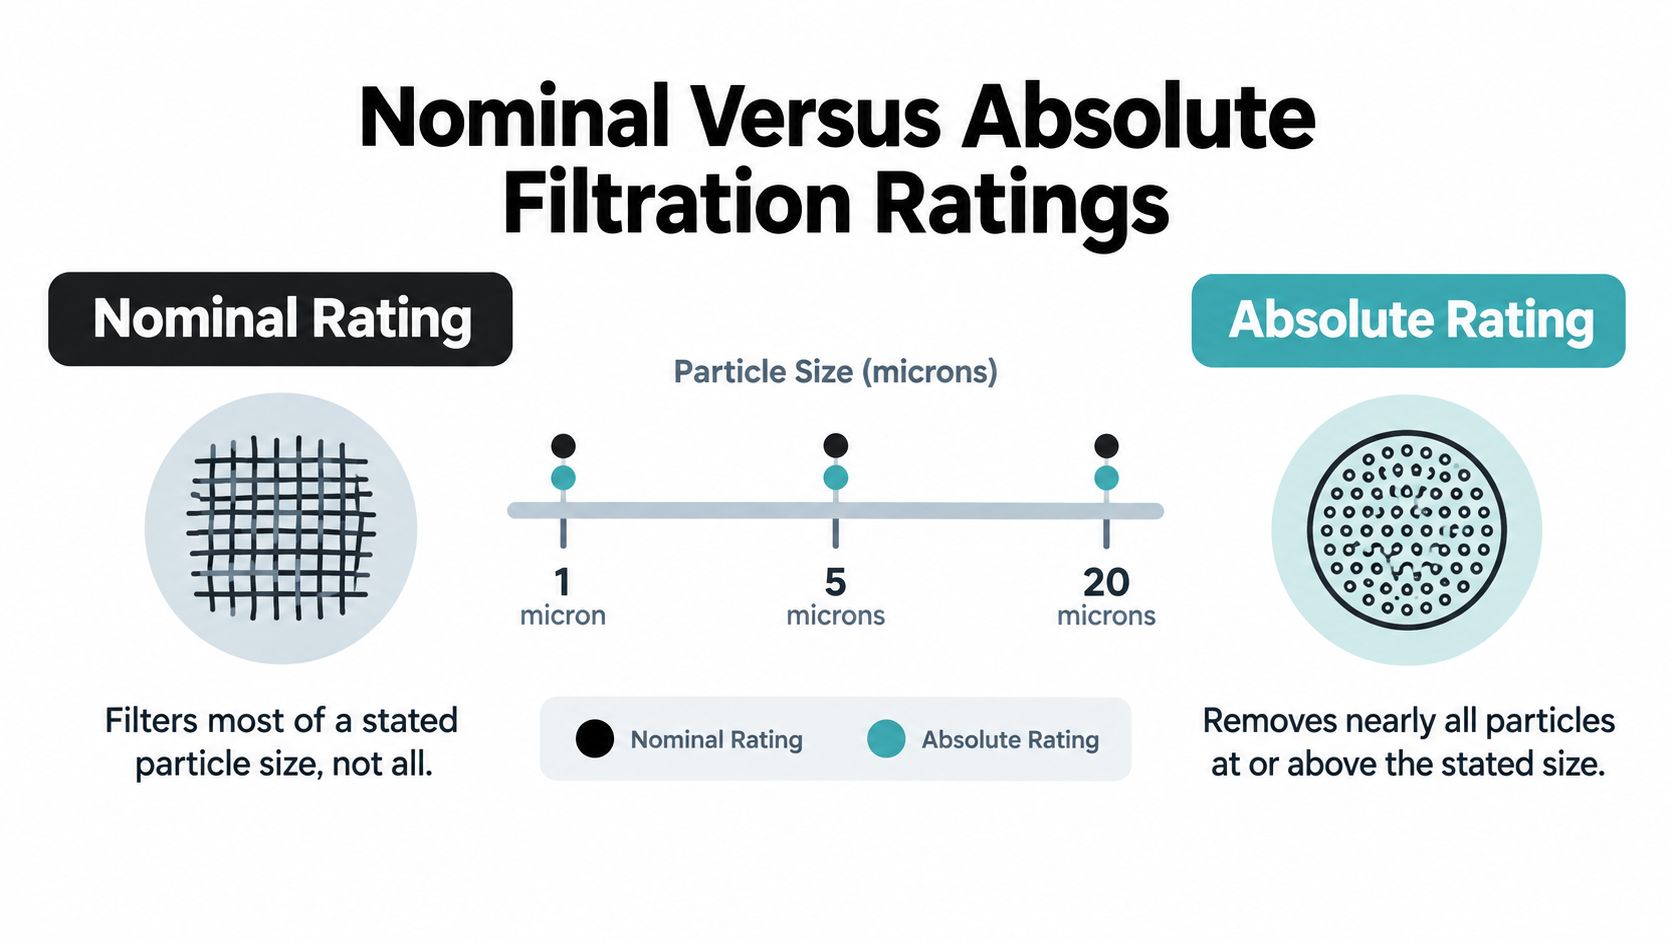
A smaller micron number does not automatically make a filter the right choice. A micron filter chart shows particle and pore sizes, but the rating is useful only when you know whether it is nominal or absolute, a distinction covered in the CDC guidance on choosing home water filters. One micron equals one-millionth of a meter, or 0.001 millimeter.
An absolute filter has pores no larger than its stated rating. An absolute 1-micron filter is therefore designed to capture particles larger than 1 micron. A nominal, or mean, 1-micron filter has an average pore size of 1 micron, so some larger particles can pass through its larger openings.
Why the distinction affects equipment selection
A label showing “1 micron” is incomplete. Check the rating type, test conditions, flow rate, intended contaminant, and any certified performance claim. Two cartridges with the same printed number may perform differently when one is nominal and the other is absolute.
As noted above, an absolute 1-micron filter has pores no larger than 1 micron, while a nominal filter may allow some larger particles through. That difference affects whether a cartridge is suitable for a specific pretreatment or cyst-reduction stage. It also matters when a homeowner connects a filter rating to a health-related outcome.
Product literature commonly uses “micron,” while technical documents may use µm. The wording does not change cartridge performance.
How to read a specification sheet
Review these details before comparing cartridges:
- Rating type: Confirm whether the value is nominal or absolute.
- Performance claim: Identify the particle or contaminant tested by the manufacturer.
- Flow conditions: Check rated flow and expected pressure loss.
- Certification: Verify whether an independent standard supports the claim.
- System role: Determine whether the cartridge protects a membrane, improves clarity, or supports a health-related objective.
A nominal rating can suit sediment control, but it is not interchangeable with an absolute rating for microbiological protection. In a whole-house RO system, the prefilter usually reduces the physical load reaching the membrane. The membrane addresses dissolved contaminants that ordinary micron charts cannot represent, while certified treatment claims must be judged separately.
For Southwest Florida well water, this distinction helps prevent a common sizing error: installing the finest available cartridge as the first stage. A nominal sediment filter may be appropriate for the initial load, followed by finer protection where the equipment requires it. The correct sequence depends on the water analysis, system flow, pressure conditions, and the membrane manufacturer's requirements.
Particle Sizes and Contaminant Thresholds
A micron chart is useful for suspended particles, but it cannot select treatment for every contaminant in well water. The NSF explanation of water-treatment standards provides relevant size ranges. Read them as treatment guidance, not as proof that one cartridge removes every substance.
| Contaminant Type | Approximate Size | Required Filtration Method |
|---|---|---|
| Giardia lamblia | 8–12 microns | Appropriate cyst-rated filtration or another validated treatment |
| Cryptosporidium parvum | 4–6 microns | Absolute 1-micron filtration or a filter labeled for cyst reduction |
| Common bacteria | About 0.2–4 microns | Submicron filtration or another validated disinfection or treatment process |
| Viruses | Roughly 0.004–0.1 micron | Advanced membrane treatment or validated disinfection |
| Dissolved salts, nitrate, arsenic, and many metals | Not represented by ordinary particle-size charts | Treatment selected from laboratory results, often including RO or specialized media |
Reading the biological thresholds
Size alone does not establish protection. EPA guidance places Giardia lamblia at approximately 8–12 microns and Cryptosporidium parvum at approximately 4–6 microns, with bacteria spanning about 0.2–4 microns and viruses roughly 0.004–0.1 micron.
Because Cryptosporidium can fall within the 4–6 micron range, a nominal 1-micron cartridge may miss it. An absolute 1-micron rating, or an explicit cyst-reduction claim, addresses that gap more directly. The distinction matters because a nominal rating describes typical retention, while an absolute rating sets a defined particle-retention threshold under stated test conditions.
Bacteria require separate evaluation. CDC guidance identifies an absolute pore size of 0.3 micron or smaller as the relevant threshold for catching bacteria. That specification does not make a cartridge a complete microbiological treatment system. Flow, installation, maintenance, and the product's validated claim still determine actual performance.
The dissolved-contaminant gap
Arsenic, nitrate, salts, and many metals are dissolved in water. They are not suspended particles that a smaller sediment pore can reliably trap, so a homeowner cannot choose their treatment from a micron chart alone.
Laboratory testing should identify the contaminant before equipment is selected. Results showing dissolved solids or specific dissolved metals shift the decision toward membrane chemistry, operating conditions, certified claims, and system capacity. Whole-house RO then serves as a treatment platform for contaminants outside ordinary particle-size charts, while sediment and other prefilters protect the equipment from physical loading.
Why Whole House Reverse Osmosis Outperforms Standard Filters
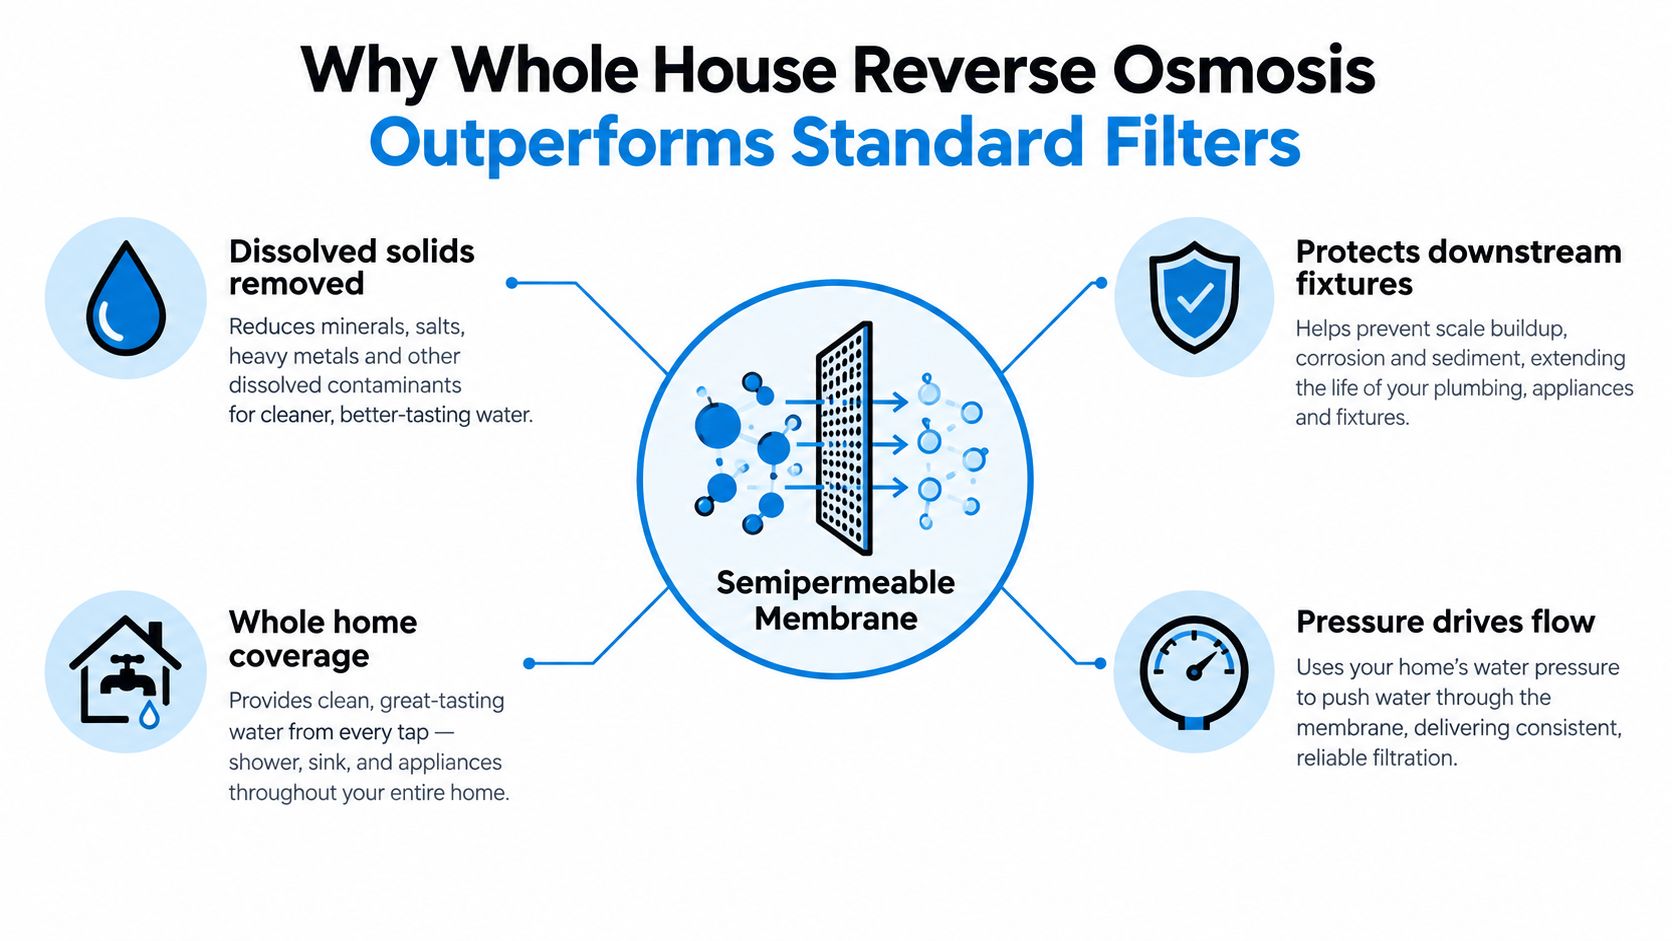
Choosing a smaller micron number does not solve dissolved-contaminant problems. Sediment filtration relies on physical interception. Water passes through cartridge media, and particles large enough to be retained remain in the filter. Reverse osmosis uses pressure to move feed water through a semipermeable membrane, creating a purified permeate stream and a concentrate stream containing a higher share of rejected substances.
EPA technical material places RO membrane pore dimensions at roughly 1 to 20 angstroms, or about 0.0001 to 0.002 microns. Microfiltration membranes are approximately 0.1 to 10 microns, according to the EPA technical material on membrane treatment. RO therefore works far below the scale of ordinary sediment cartridges, although removal depends on membrane chemistry and operating conditions.
Sediment filtration versus membrane separation
A cartridge can reduce visible particles while leaving the dissolved-water profile largely unchanged. An RO membrane addresses a broader range of dissolved substances, provided the feed water is properly conditioned. The micron chart still helps specify prefiltration, but it cannot serve as the final measure of RO performance.
The same EPA membrane-treatment study reported removals above 95% for arsenic V, calcium, cadmium, chromium, copper, lead, sodium, radium, selenium, uranium, hardness, and TDS. It reported fluoride, chloride, nitrate, and nitrite generally in the 85% to 94% range. Those results do not apply identically to every residential membrane, so the selected system and its certified claims require review.
Why whole-house treatment changes the design
Under-sink RO treats one outlet. Whole-house RO treats water before it reaches showers, kitchen fixtures, laundry points, and other outlets. That broader application requires correct sizing, storage, pressure management, and a practical plan for concentrate discharge.
A whole-house reverse osmosis system should be judged by its complete treatment process rather than an advertised “micron rating.” Check which pretreatment stages protect the membrane, which contaminants the membrane is certified to reduce, how much treated water the property requires, and how the reject stream will be handled.
Recommended Prefiltration for Southwest Florida Well Water
Whole-house RO performs best when the membrane receives water that has already been prepared for it. Private wells in Southwest Florida can carry sand, silt, iron particles, and changing seasonal turbidity. Sending that load directly toward a fine membrane can shorten service life and increase pressure loss.
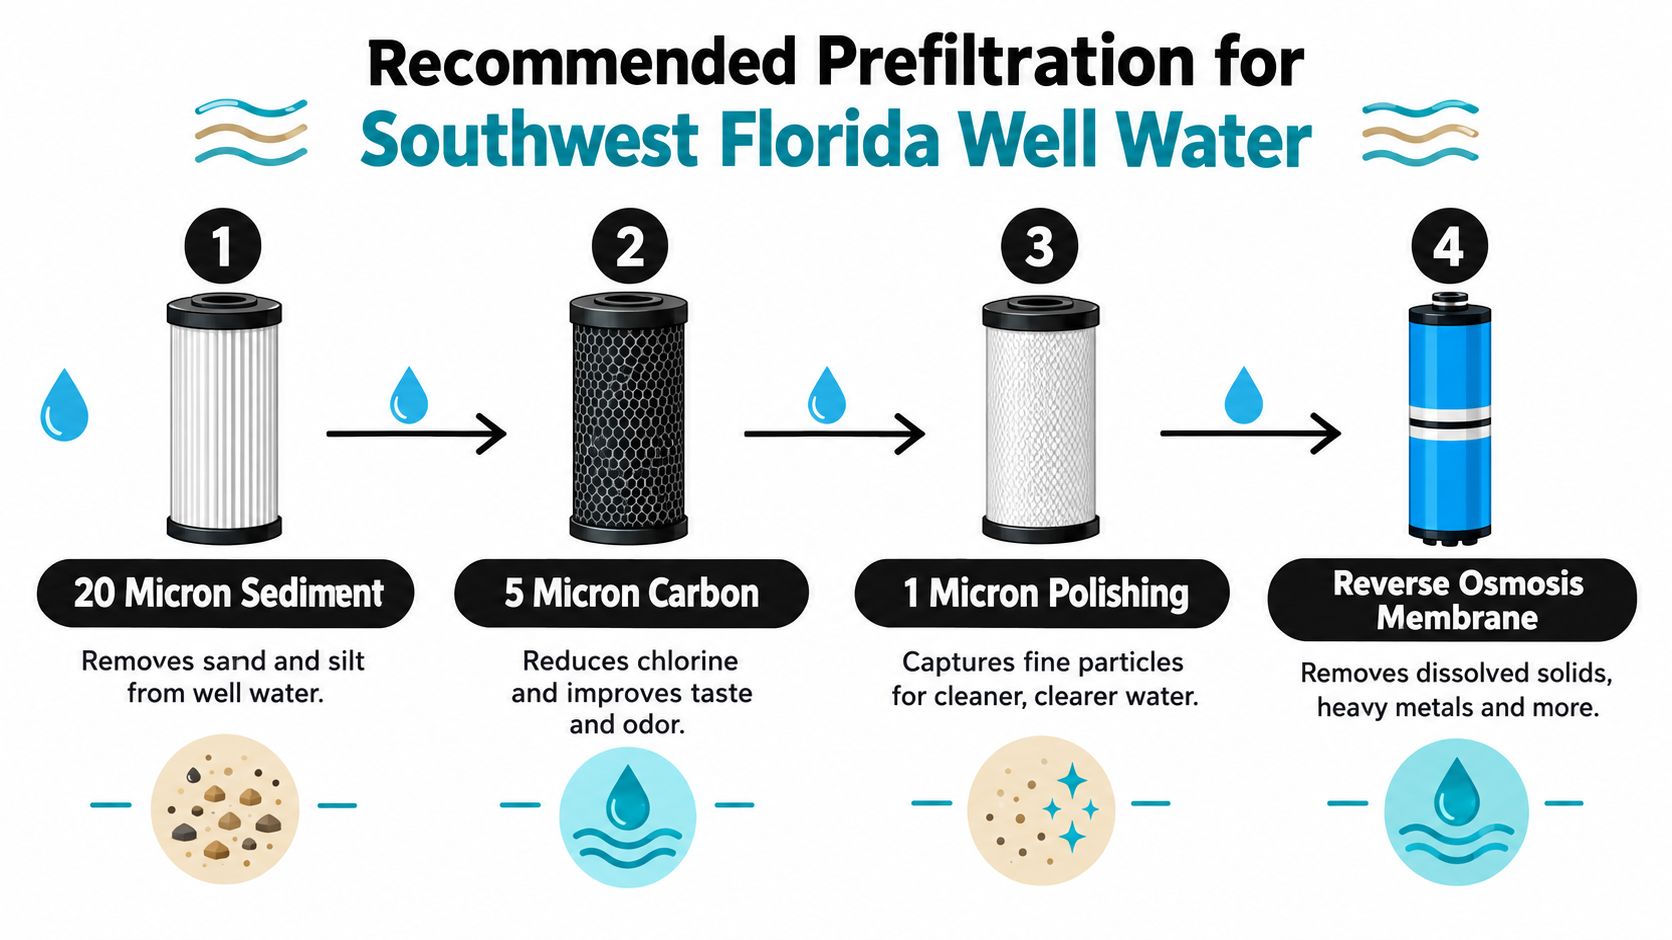
A practical staged arrangement begins with the largest physical burden and moves toward finer protection. The exact configuration must follow the well-water test and the equipment specifications, but the logic is consistent: let early stages handle coarse material so the later stages can focus on their intended work.
A staged approach
A representative sequence may include:
- Coarse sediment: A larger-rated pleated cartridge reduces sand and silt before those particles reach finer media.
- Carbon treatment: A carbon stage can address chlorine, taste, and odor where those concerns exist and where the media is appropriate for the source water.
- Fine polishing: A finer sediment stage can reduce remaining suspended material before the membrane.
- RO membrane: The membrane handles the dissolved-contaminant objectives identified by testing.
The infographic's 20-micron sediment, 5-micron carbon, and 1-micron polishing labels illustrate a staged concept, not a universal prescription. Well chemistry, flow requirements, iron loading, and the presence of disinfectants can change the correct media and sequence.
When cartridges aren't enough
Iron and hydrogen sulfide may require dedicated treatment before RO. A sediment cartridge can collect particulate iron, but it isn't a complete solution for every form of iron in well water. Chemical treatment, oxidation, specialty media, disinfection, or another process may be more appropriate after testing.
A tighter filter can also load faster when the source contains sand, iron particles, or seasonal turbidity. The water filtration chart guidance connects that loading behavior with declining pressure and reduced reliability for treatment equipment and pool-support systems. A pressure reading before and after each stage gives the technician useful evidence about where the restriction is developing.
Hardness is another separate design issue. A water softener evaluation may be appropriate when hardness threatens membrane performance or creates scale, but it should be selected from the water analysis rather than added automatically.
Balancing Flow Rate and Pressure Drop in RO Systems
Every filtration stage creates resistance. As a cartridge captures sediment, the available flow can decline. As an RO membrane operates, it needs sufficient pressure to drive water through the membrane and separate permeate from concentrate. A system that focuses only on the finest possible filtration can perform poorly if the household demand exceeds its delivery capacity.
This is why professional RO design considers flow, pressure, storage, membrane capacity, and pretreatment together. A whole-house system shouldn't be judged solely by how fine its membrane is. It should deliver treated water when the home needs it, without allowing restrictions or inadequate recovery to undermine operation.
Understanding recovery
RO recovery is the ratio of permeate volume to incoming feed-water volume. EPA WaterSense guidance reports that commercial and institutional RO systems typically recover 50% to 75% of incoming water, meaning approximately 25% to 50% becomes reject water.
Those figures describe commercial and institutional systems, not a guarantee for every residential installation. Recovery varies with membrane type, feed-water quality, configuration, and operation. A private-well system needs a design that considers both the usable permeate and the concentrate that must be handled appropriately.
Pressure loss is not just a maintenance inconvenience. It is evidence that the system's hydraulic balance needs attention.
What good sizing accounts for
A competent design review should examine:
- Source-water condition: Sediment, iron, hardness, disinfectants, and dissolved contaminants affect pretreatment and membrane performance.
- Household demand: The system must support actual use patterns rather than a generic capacity assumption.
- Storage strategy: A properly selected tank can help meet demand when instantaneous membrane production is limited.
- Reject-water planning: Concentrate volume should be considered before installation.
- Service indicators: Pressure changes across stages can show when cartridges need attention.
A point-of-use under-sink reverse osmosis system has a different hydraulic mission from whole-house RO. Treating the two as interchangeable often leads homeowners to compare equipment on the wrong criteria. Whole-house treatment requires a coordinated delivery system, not just a smaller cartridge or a larger membrane.
NSF Certifications and Performance Standards
A product's micron number doesn't prove that it reduces a specific contaminant. Certification gives the homeowner a better way to compare tested performance, provided the claim matches the actual water problem.
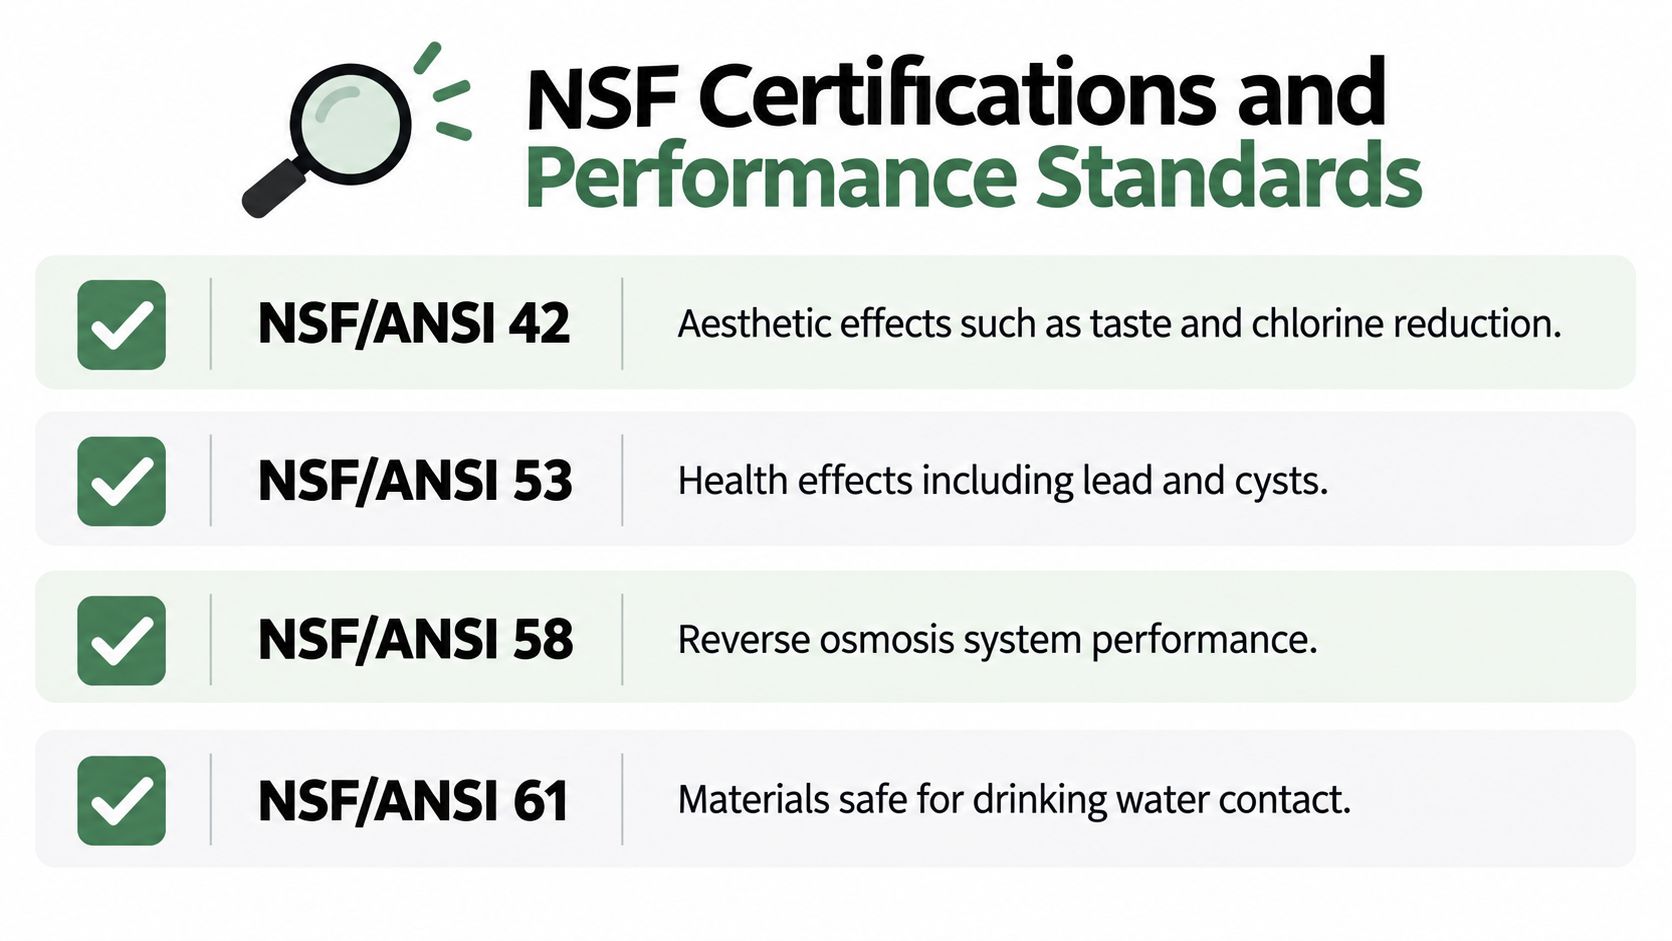
The NSF overview of water-treatment standards identifies NSF/ANSI 42 for aesthetic effects such as taste and odor, NSF/ANSI 53 for health-related claims including cyst reduction, and NSF/ANSI 58 for reverse-osmosis systems. Residential treatment standards are generally voluntary rather than federal product regulations, so the buyer should verify the exact listing and claim.
What NSF/ANSI 58 tells you
EPA documentation states that systems evaluated for TDS reduction under NSF/ANSI 58 must reduce TDS by at least 75%. The standard also includes recovery rating and contaminant-reduction performance, with optional claims for arsenic, nitrate/nitrite, lead, barium, fluoride, copper, perchlorate, radium, selenium, and VOCs, as described in the EPA supporting statement for RO systems.
That doesn't mean every certified RO system carries every optional claim. The homeowner should match the certification record to the laboratory report. If nitrate is the concern, look for a verified nitrate claim. If arsenic is present, verify the relevant arsenic claim and the applicable test conditions.
A practical verification checklist
Before approving an installation, ask for:
- The exact model number: Certification applies to specific products and configurations.
- The listed contaminant claims: Don't accept a general statement that the system “removes impurities.”
- The test standard: Confirm whether the claim relates to NSF/ANSI 42, 53, 58, or another applicable standard.
- Operating conditions: Flow, pressure, feed-water quality, and replacement requirements can affect results.
- Maintenance requirements: A certified claim still depends on proper operation and timely service.
A smaller micron rating may look impressive in an advertisement, but it doesn't replace a verified contaminant-reduction claim. Certification turns a general marketing statement into a performance question that can be checked.
Designing a Custom Water Treatment Strategy
A micron filter chart is a reference tool, not a complete system design. For a private well, the correct process begins with laboratory testing that identifies suspended solids, hardness, dissolved solids, metals, nitrate, biological concerns, and other relevant conditions. Without that information, equipment selection becomes guesswork.
The next step is evaluating the home's hydraulic demands. A whole-house RO installation must account for treated-water demand, membrane capacity, storage, operating pressure, pretreatment, and the concentrate stream. The EPA overview of drinking-water treatment technologies describes whole-house RO as a membrane-separation process in which pressurized feed water creates a purified permeate stream and a concentrate or reject stream retaining higher-molecular-weight substances and many undesirable contaminants.
A sound design process
A qualified assessment should:
- Test the source water: Select treatment from measured contaminants rather than assumptions about local well conditions.
- Map the flow and pressure profile: Determine whether the proposed system can serve the property's actual demand.
- Build pretreatment around the well: Use sediment control, carbon, iron treatment, softening, disinfection, or other media only where the analysis supports it.
- Select verified RO performance: Match the membrane and certification claims to the contaminants found.
- Plan storage and concentrate handling: Treat water production and reject-water management as part of the installation, not afterthoughts.
For homeowners, property managers, HOAs, and light commercial facilities in Southwest Florida, that level of planning protects more than water clarity. It helps preserve membrane performance, maintain usable flow, and avoid paying for cartridges that are being asked to solve the wrong problem.
Water Medic of Cape Coral evaluates private-well conditions, designs whole-house reverse osmosis systems, and builds the prefiltration and storage strategy around your water test and household demand. Visit Water Medic of Cape Coral to arrange a professional water-treatment assessment for a properly sized system.